[Home]   [Installation Information] [Docker Install] [Kubernetes Install] [Configuration Parameters] [Network Control via Ansible] [Operations]

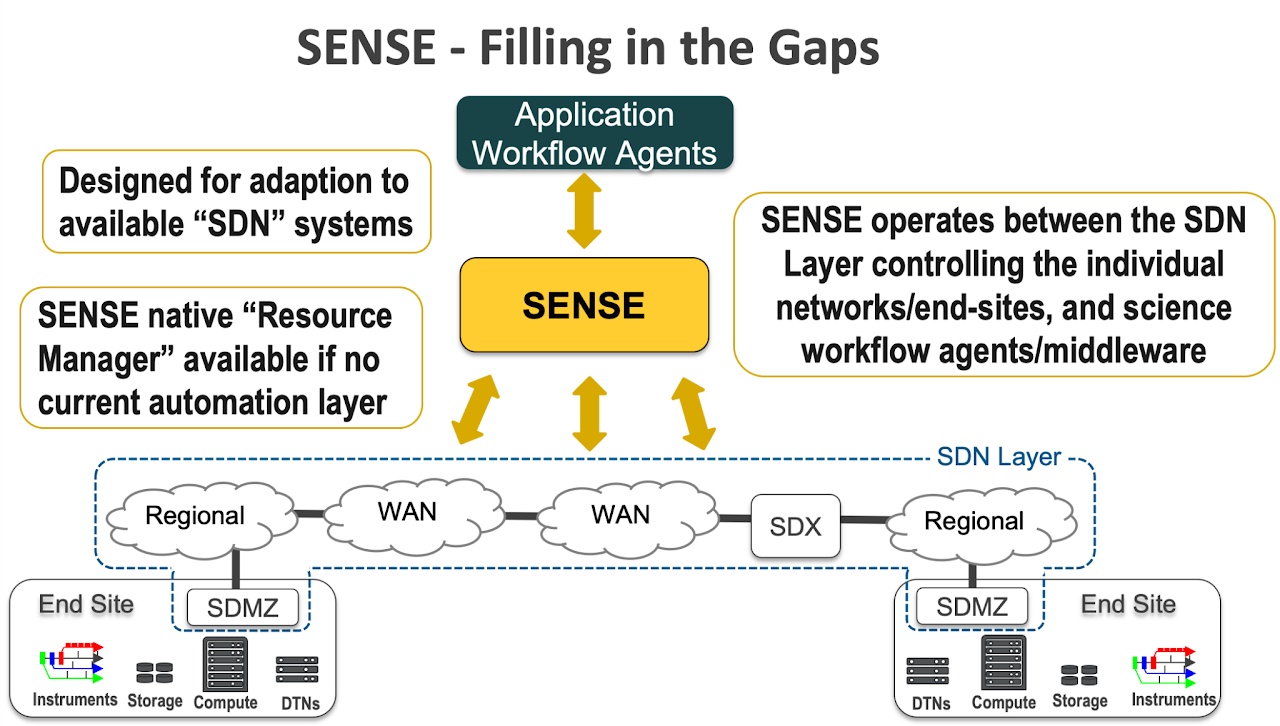
The overarching goal of SENSE is to enable National Labs and Universities to request and provision end-to-end intelligent network services for their application workflows, leveraging SDN capabilities. Our approach is to design network abstractions and an operating framework to allow host, LAN, and WAN auto-configurations based on infrastructure policy constraints designed to meet end-to-end service requirements.

We are working on a comprehensive approach that combines deployment of SDN infrastructure across multiple labs/campuses and WAN with a focus on usability, performance and resilience through: Policy-guided end-to-end orchestration of network resources, in a manner coordinated with the science programs’ systems that provide real time orchestration of computing and storage resources. Auto-provisioning of network devices and Data Transfer Nodes (DTNs); Intent-based, real time application interfaces providing intuitive access by Virtual Organization (VO) services and managers to intelligent SDN services; Network real time measurement, analytics and feedback to build resilience, and provide the foundation for coordination between the SENSE intelligent network services, and the science programs’ system services.

An important feature of SENSE is a coherent, responsive and adaptive end-to-end administration and management solution for SENSE Orchestrator and Resource Managers. These features must support sufficient quality assurance and reliability to provide a high level of workflow efficiency in concert with the science program services, and a reasonable Quality of Experience (QoE) for any administrator of this highly distributed environment. This includes all aspects of a virtualized service lifecycle including: Resource Reservation Phase; Resource Setup/Teardown Phase; Resource usage Phase; Post Processing/Analysis.

Coordination with the Intent and Rendering Service and all components of the solution is a key aspect to driving coherent collection and correlation of service-related events during all phases of the service lifecycle. This information will need to be made available to the Intent and Rendering Service for correlation to orchestrated services that may have been impacted.

This is a key part of any production service offered to an end-user, and one that is often ignored. The SENSE project will investigate the right components to monitor and the metrics to determine the appropriate health of the component.

This Product (Application) requirements document contains description about the Resource Managers and Orchestrator, the requirements for coherent end-to-end monitoring, their measurements and management of this service.

Alt text

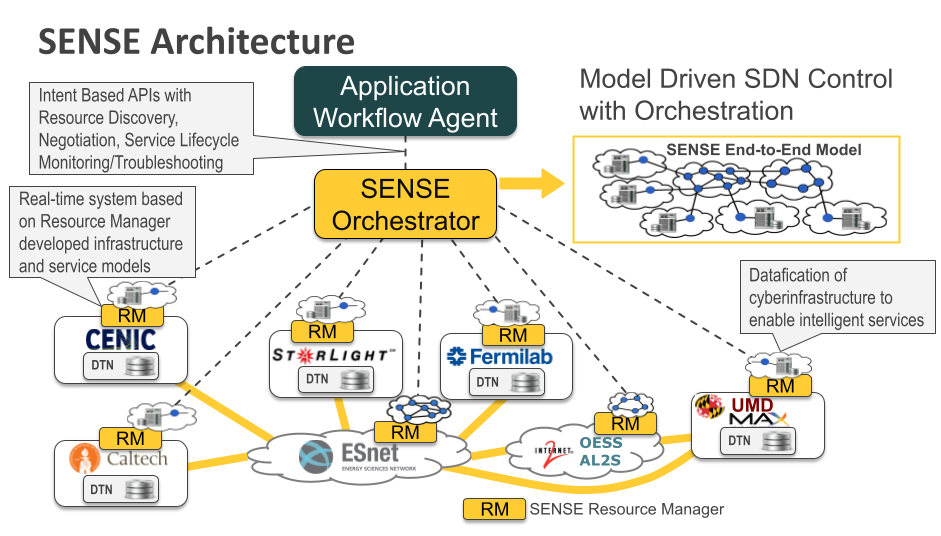
SENSE Architeture

In the SENSE Architecture there are two distinct functional roles: Orchestrators and Resource Managers. The interaction between Orchestrator(s) and Resource Manager(s) follows a hierarchical workflow structure whereby of the Orchestrator accepts requests from users, user applications, and science program-operated management services and determines the appropriate Resource Managers to contact and coordinate the End-To-End service request. Resource Managers (RMs) are (administrative or technology) domain specific and are responsible for committing and managing local resources. In further section, we describe Data Transfer Node Resource manager;

Data Transfer Node Resource Manager

A Data Transfer Node (DTN) is a server that constitutes the endpoint of a data transfer. From the scientific application point of view, DTNs are the source and destination of the data. In the context of SENSE and SDN in general, a few important DTN features are important. They are described in the following list:

Flow Termination: The ability to terminate a (known, trusted) flow, for example on a DTN or other Science DMZ end-point. Flow Termination involves the termination of a flow and consumption of the flow packets by an application or NFV process. The DTNs are a typical flow termination point.

Future flow termination points may include NFV based routers for integration of Science DMZ flows with campus and science program-managed infrastructures, storage systems, NAT services, application specific codes, or other value added services.

End system configurations and monitoring need to be integrated into the overall End-To-End service orchestration. This is made programmable by creating an instance of the cluster groups that focuses on hosts, and contains policies to manage such configurations by the DTN administrator. Higher level monitoring DTN-RM Agents also have software agents running on the end-system that communicate with the SENSE-Orchestrator controller, and automates Layer 2 and Layer 3 configurations; For example, switching traffic through Open vSwitch and later other local site cluster SDN-capable controllers. These configurations include VLANs, IP Addresses, data transfer protocols, host pacing and other feature sets which are needed as part of application processes.

The DTN Resource Manager provides information with regards to switch and host system specs, OS, software configuration of the system, etc. in MRML format. This allows external users/applications within SENSE to obtain the necessary details for understanding the capability offered by the DTN.

In addition to this information which is static, i.e. does not vary over time (or varies infrequently), it also exposes real time information about the state of the DTN, such as the load on the server and network, etc. In the following sections we also describe other information that will be exposed, such as info about the profiling of the system and applications.

An end-host agent will be present on the DTN to provide a complete profile of the end-system in terms of its performance and various (CPU, IO, storage) load levels, updated in real time. This is needed to monitor and track end-system health, to match network performance to the (loaded) expected capability and, where needed, to distinguish network problems from end-host problems in case the achievable throughput is degraded.

Architecture and Implementation Plans

Alt text DTN-RM Architecture diagram explanation (from bottom to top):

  • DTN-RM Agent consist several components, which are responsible for the following actions:
    • Pluggable Service Layer implementation allows to plug-in new component through recurring action mechanism. By default, component has these plug-ins available:
      • System Statistics - Information about CPU (lscpu), Memory (/proc/meminfo) and Storage information (df –output=source,fstype,itotal,iused,iavail,ipcent,size,used,avail,pcent,target);
      • Network Statistics plugin gathers all information about NIC interfaces, like: family, address, netmask, broadcast, ptp, bytes_sent, bytes_recv, packets_sent, packets_recv, errin, errout, dropin, dropout, type, txqueulen;
      • Application Statistics plugin stores information about these application configurations: GridFTP, FDT, XRootD, HTCondor-CE.
    • Every plugin also gathers its own historical information about usage from Monitoring Application and prepares consolidated values for these ranges (1 minute, 15minutes, 1hour, 6hours, 12hours). After each information gathering iteration, DTN-RM Agent sends all collected information (JSON format) to Site Frontend for MRML schema preparation.
    • Ruler Component queries Site Frontend for any state or system change or specific action, which is approved at the Site Level Frontend as allowed action.
    • Real Time Monitoring component monitors all system statistics, usage and stores this information in Time Series database. Also, it provides a Restful interface for getting specific metric information and HTML based web page for debugging. Restful API interface and HTML web page is accessible through Site Frontend Forwarding Service.
    • QOS (Quality of Service) makes sure that appended policies are respected, does traffic shaping, make sure resource requests do not overcommit what was requested. In case policy request neglect or overcommit requested resources, Site Level Frontend is informed and action is taken.
  • Site Frontend is a gateway for any information consumer or action appender to specific data transfer node agent. More detailed components:
    • GUI - Graphical user interface about Site Topology, all Site Resources, their capabilities, statistics, pending and committed actions.
    • Restful API accepts action updates from higher level services (etc.: Orchestrator, Global Frontend) and also accepts JSON information about their statistics from all DTN-RM Agents.
    • LookUp Service is responsible for gathering, analyzing and preparing MRML schema about all Site DTN-RM Agents. In case update is not received for a specified time range, Notification Service is informed about situation.
    • Real Time Monitoring Component responsibilities are the same as in DTN-RM Agent, to monitor all system statistics, usage and store all information in Time Series database. Also, as DTN-RM Agent, it provides Restful interface and HTML web page accessible through Forwarding Service.
    • Notification Service informs Site Administrators by sending an email about occured action updates, system instabilities, usage, failures.
    • Forwarding Service works as a proxy to access monitoring Restful interface, HTML web pages and also Repository information. Site Frontend is also able to forward a request to any DTN-RM Agent (No actions or status updates are forwarded directly to Site Agents).
    • Policy Service responds to user requested deltas and state changes.
    • Provisioning Service keeps all information about stored future deltas and reservations. Whenever specific time is reached for delta request is forwarded to Site DTN-RM Agent. Also, it is responsible for the following actions:
      • Prepare information about the all switches and links. Also it provides all statistics about possible vlan ranges;
      • Apply rules to a specific controller. There are two main controllers currently being developed: Static vlans and OVS.
  • Time Series Database accepts all information updates from all components and stores them in database. Values stored in database are consolidated to minimize database size. To review historical information, Time Series Database provides Restful interface and HTML web page for debugging purposes. All of this information is accessible through Forwarding Service.

  • Higher level Service is running a Top FE (Top Frontend) which is nearly similar to the Site Frontend functionality. Any Site Level Frontend can register to one higher level frontend, which allows to keep a track of all available Sites and their DTN-RM Agents. Site Frontend has to register only with one Top Frontend, and in case there are multiple Top FEs, they share this information through Restful APIs and make sure that each Frontend knows about all Sites. Top Frontend is not running these components: Policy Service and Provisioning Service because these functions are handled in the Site Frontend components. This architecture and expansion allows not to have any Single point of failure and make sure that any instabilities are visible right away. Some differences between Top Frontend and Site Frontend:
    • GUI (Graphical User Interface) provides a map with site endpoints and links (Global Topology) between them. More higher level statistics about failures on Sites, links and also forwarding links to Site Frontend. Addition to Top Frontend is that it keeps a track of all Sites and their available resources. (Site Frontend keeps track of all DTN-RM Agents)
    • LookUp Service is responsible for gathering, analyzing and preparing MRML schema from all Site Frontends (Site Frontend - from Site DTN-RM Agents). In case update is not received for a specified time range, Notification Service is informed about situation.
    • Notification Service informs higher level administrators by sending an email about occured action updates, system instabilities, usage, failures. Also, same information is sent to Site Administrator.
    • Forwarding Service works as a proxy to access monitoring Restful interface, HTML web pages and also Repository information. Top Frontend is also able to forward any request to any Site Frontend, which can be also an action request or status update for the Site.
  • Time Series Database accepts all information updates from all components and stores them in database. Also it accepts any historical information from other Time Series Database, and filters values which to store in database. Values stored in database are consolidated to minimize database size. To review historical information, Time Series Database provides Restful interface and HTML web page for debugging purposes. All of this information is accessible through Forwarding Service.
  • Authorization and Authentication will use X509 and Grid-based certificate requirement. In order to guarantee strong security, for any HTTPS based configuration it also has Strict-Transport-Security option mandatory. The authentication and authorization part is done in the way that it has several options to choose at each level what actions are allowed for a given user. By default, any Frontend described in this document will require 2 ports open in firewall: 443, 8443.